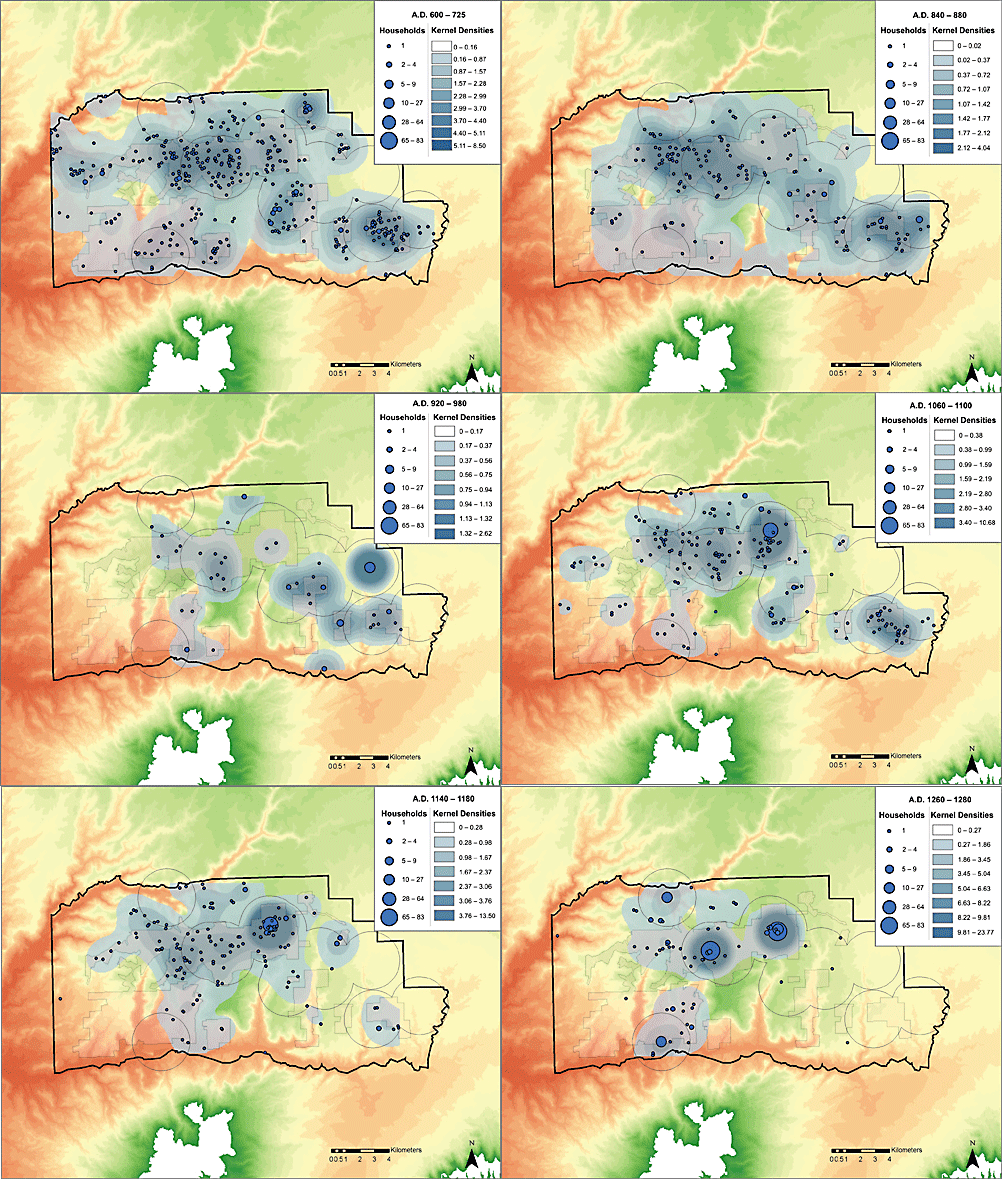
Figure 14. Kernel density analysis of habitations by modeling period, McElmo Dome.
 |
Figure 14. Kernel density analysis of habitations by modeling period, McElmo Dome. |
| Figure 14. Kernel density analysis of habitations by modeling period, McElmo Dome. |
Copyright © 2007 by Crow Canyon Archaeological Center. All rights reserved. |